Lapsly features: training, attendance, mileage, results
Lapsly gathers the most important club data in one place: training groups, trainings with mileage and attendance, tests, meet results (including LENEX import), rankings, athlete comparisons, and reports.
Feature categories
Click a category to jump to details. Each section includes overview + key points + screenshots.
Manage groups like a coach workspace
A group in Lapsly is the center of work: athlete and coach list, recent trainings, attendance, tests, results and reports — everything in one place without jumping between modules.
- Group cards: name, number of athletes, coaches, training count
- Create a group in 1 step (name) + edit
- Group detail tabs: Group / Trainings / Attendance / Tests / Results / Reports
- Add athletes manually or “by birth year”
- Add coaches + quick jumps to lists and results
“Recent trainings” section
A quick snapshot of recent sessions to keep context and rhythm.
Quick comparison
“Compare athletes” tile as a natural path to selection and analysis.
Screens: groups
2 screenshots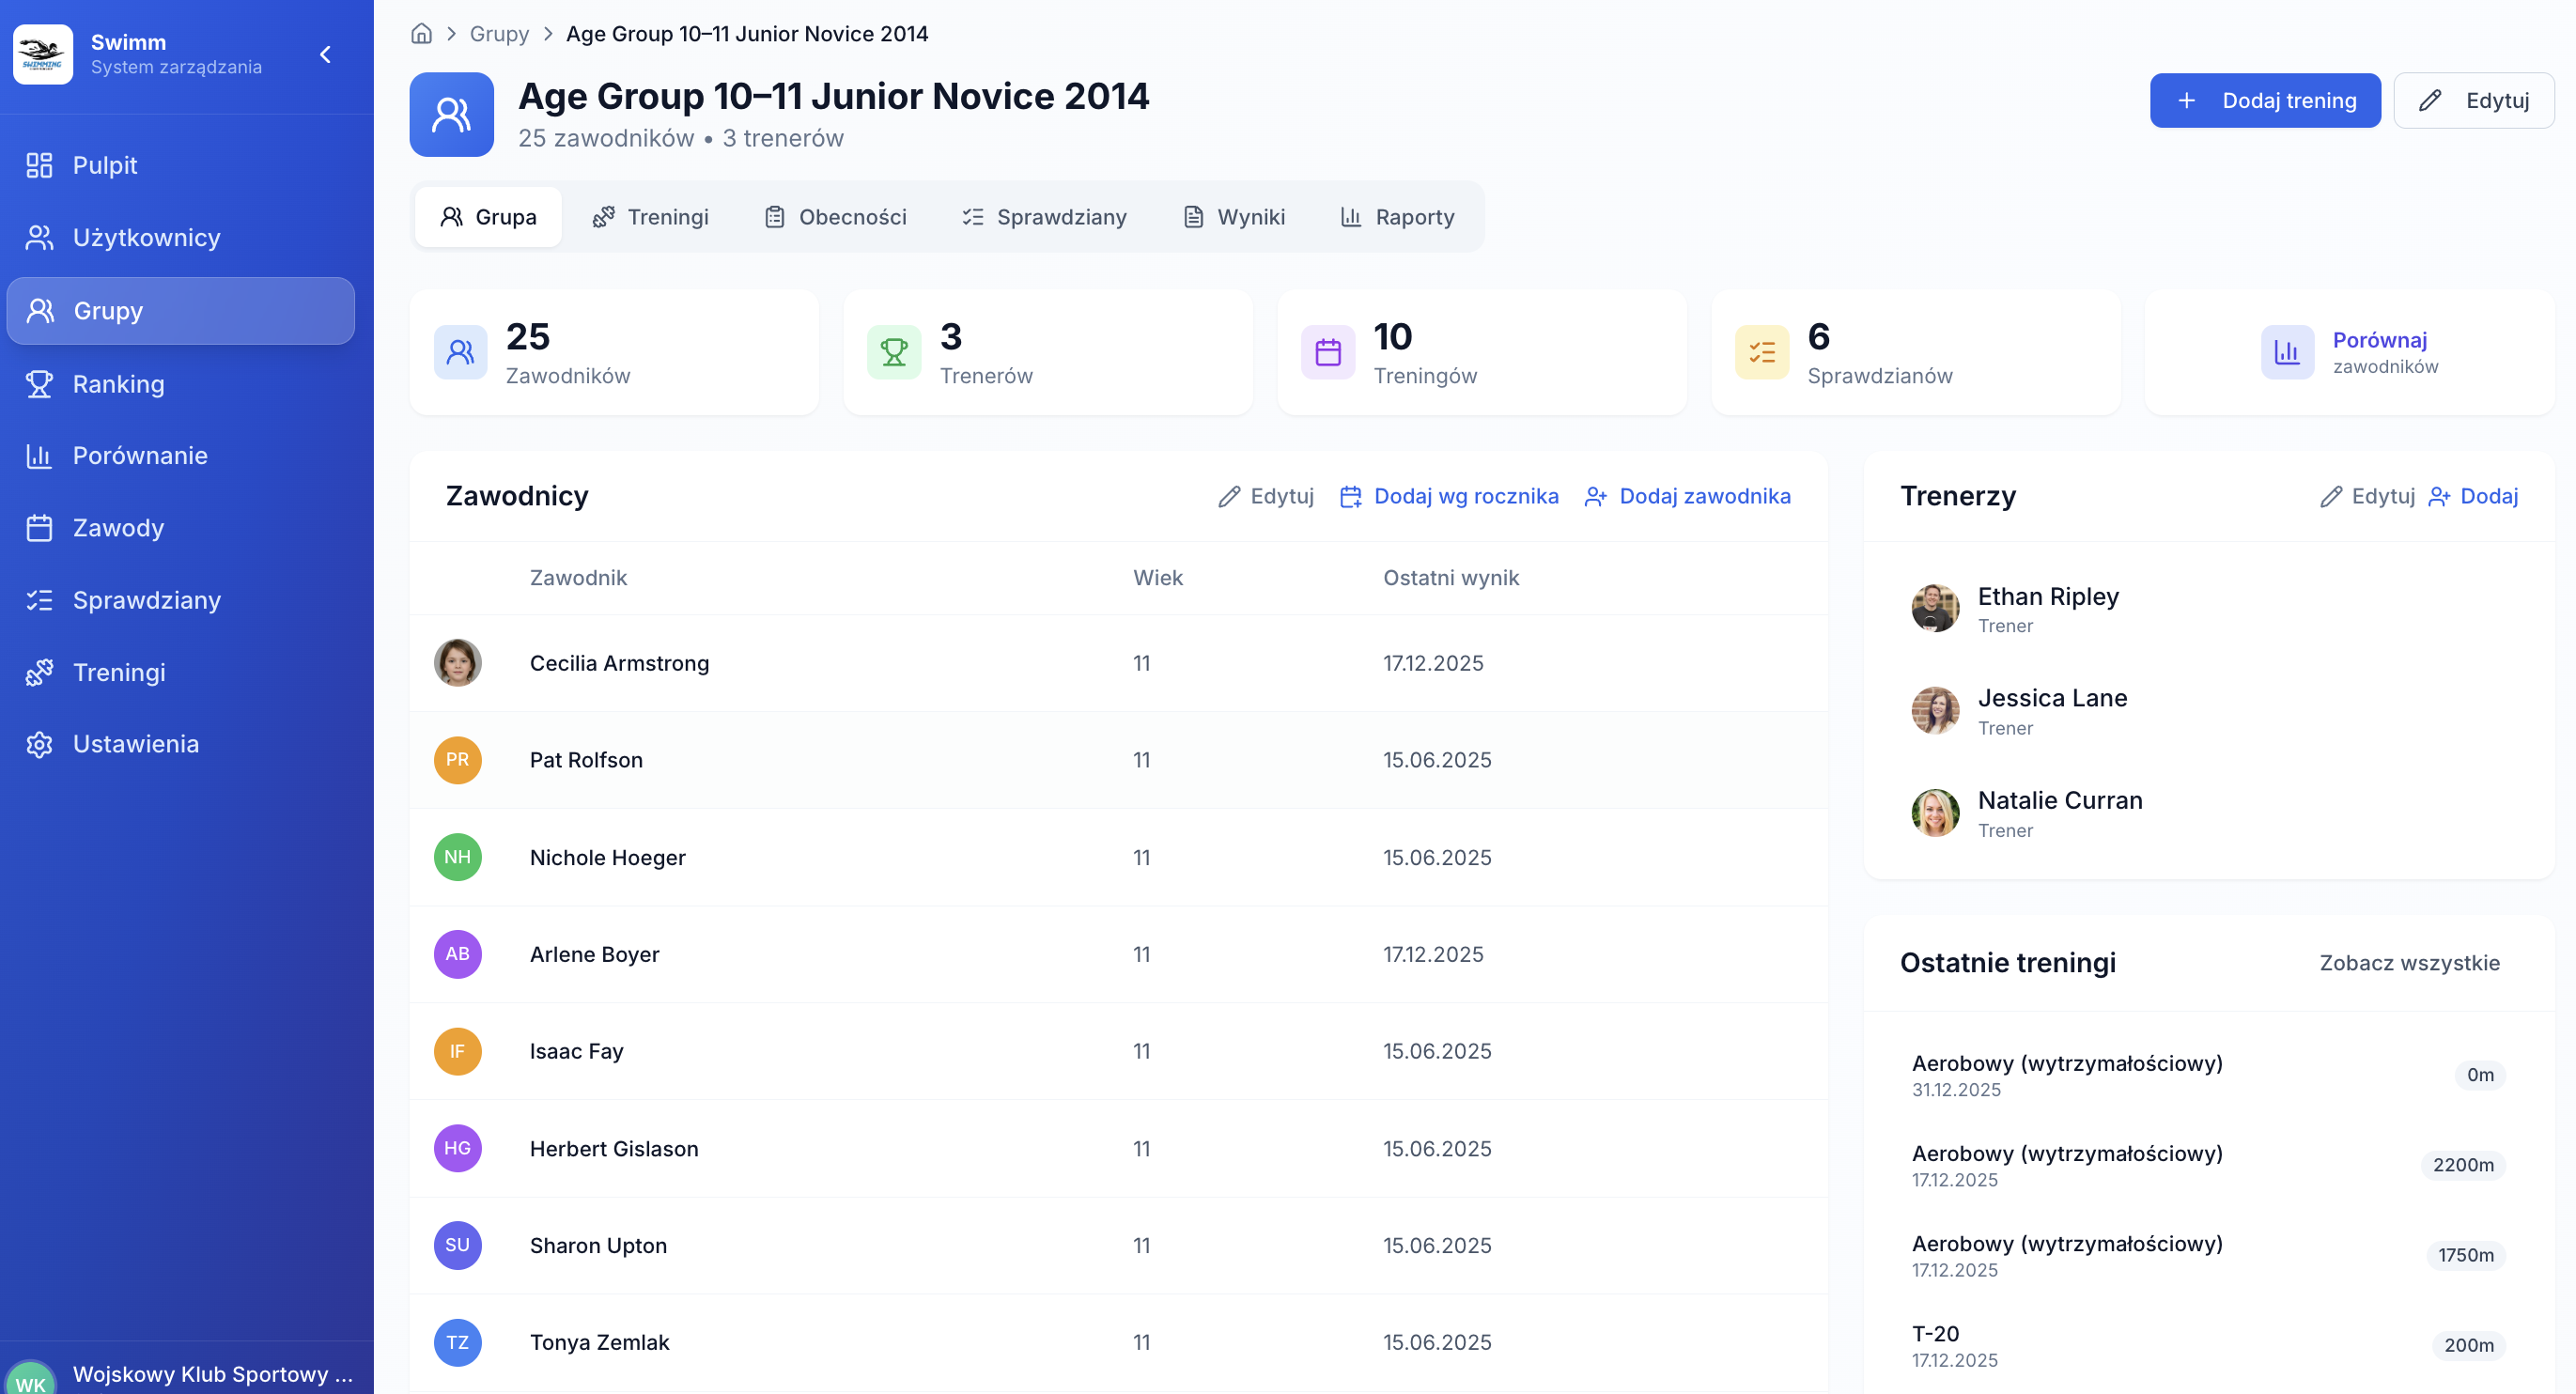
Screens: trainings & mileage
2+ screenshots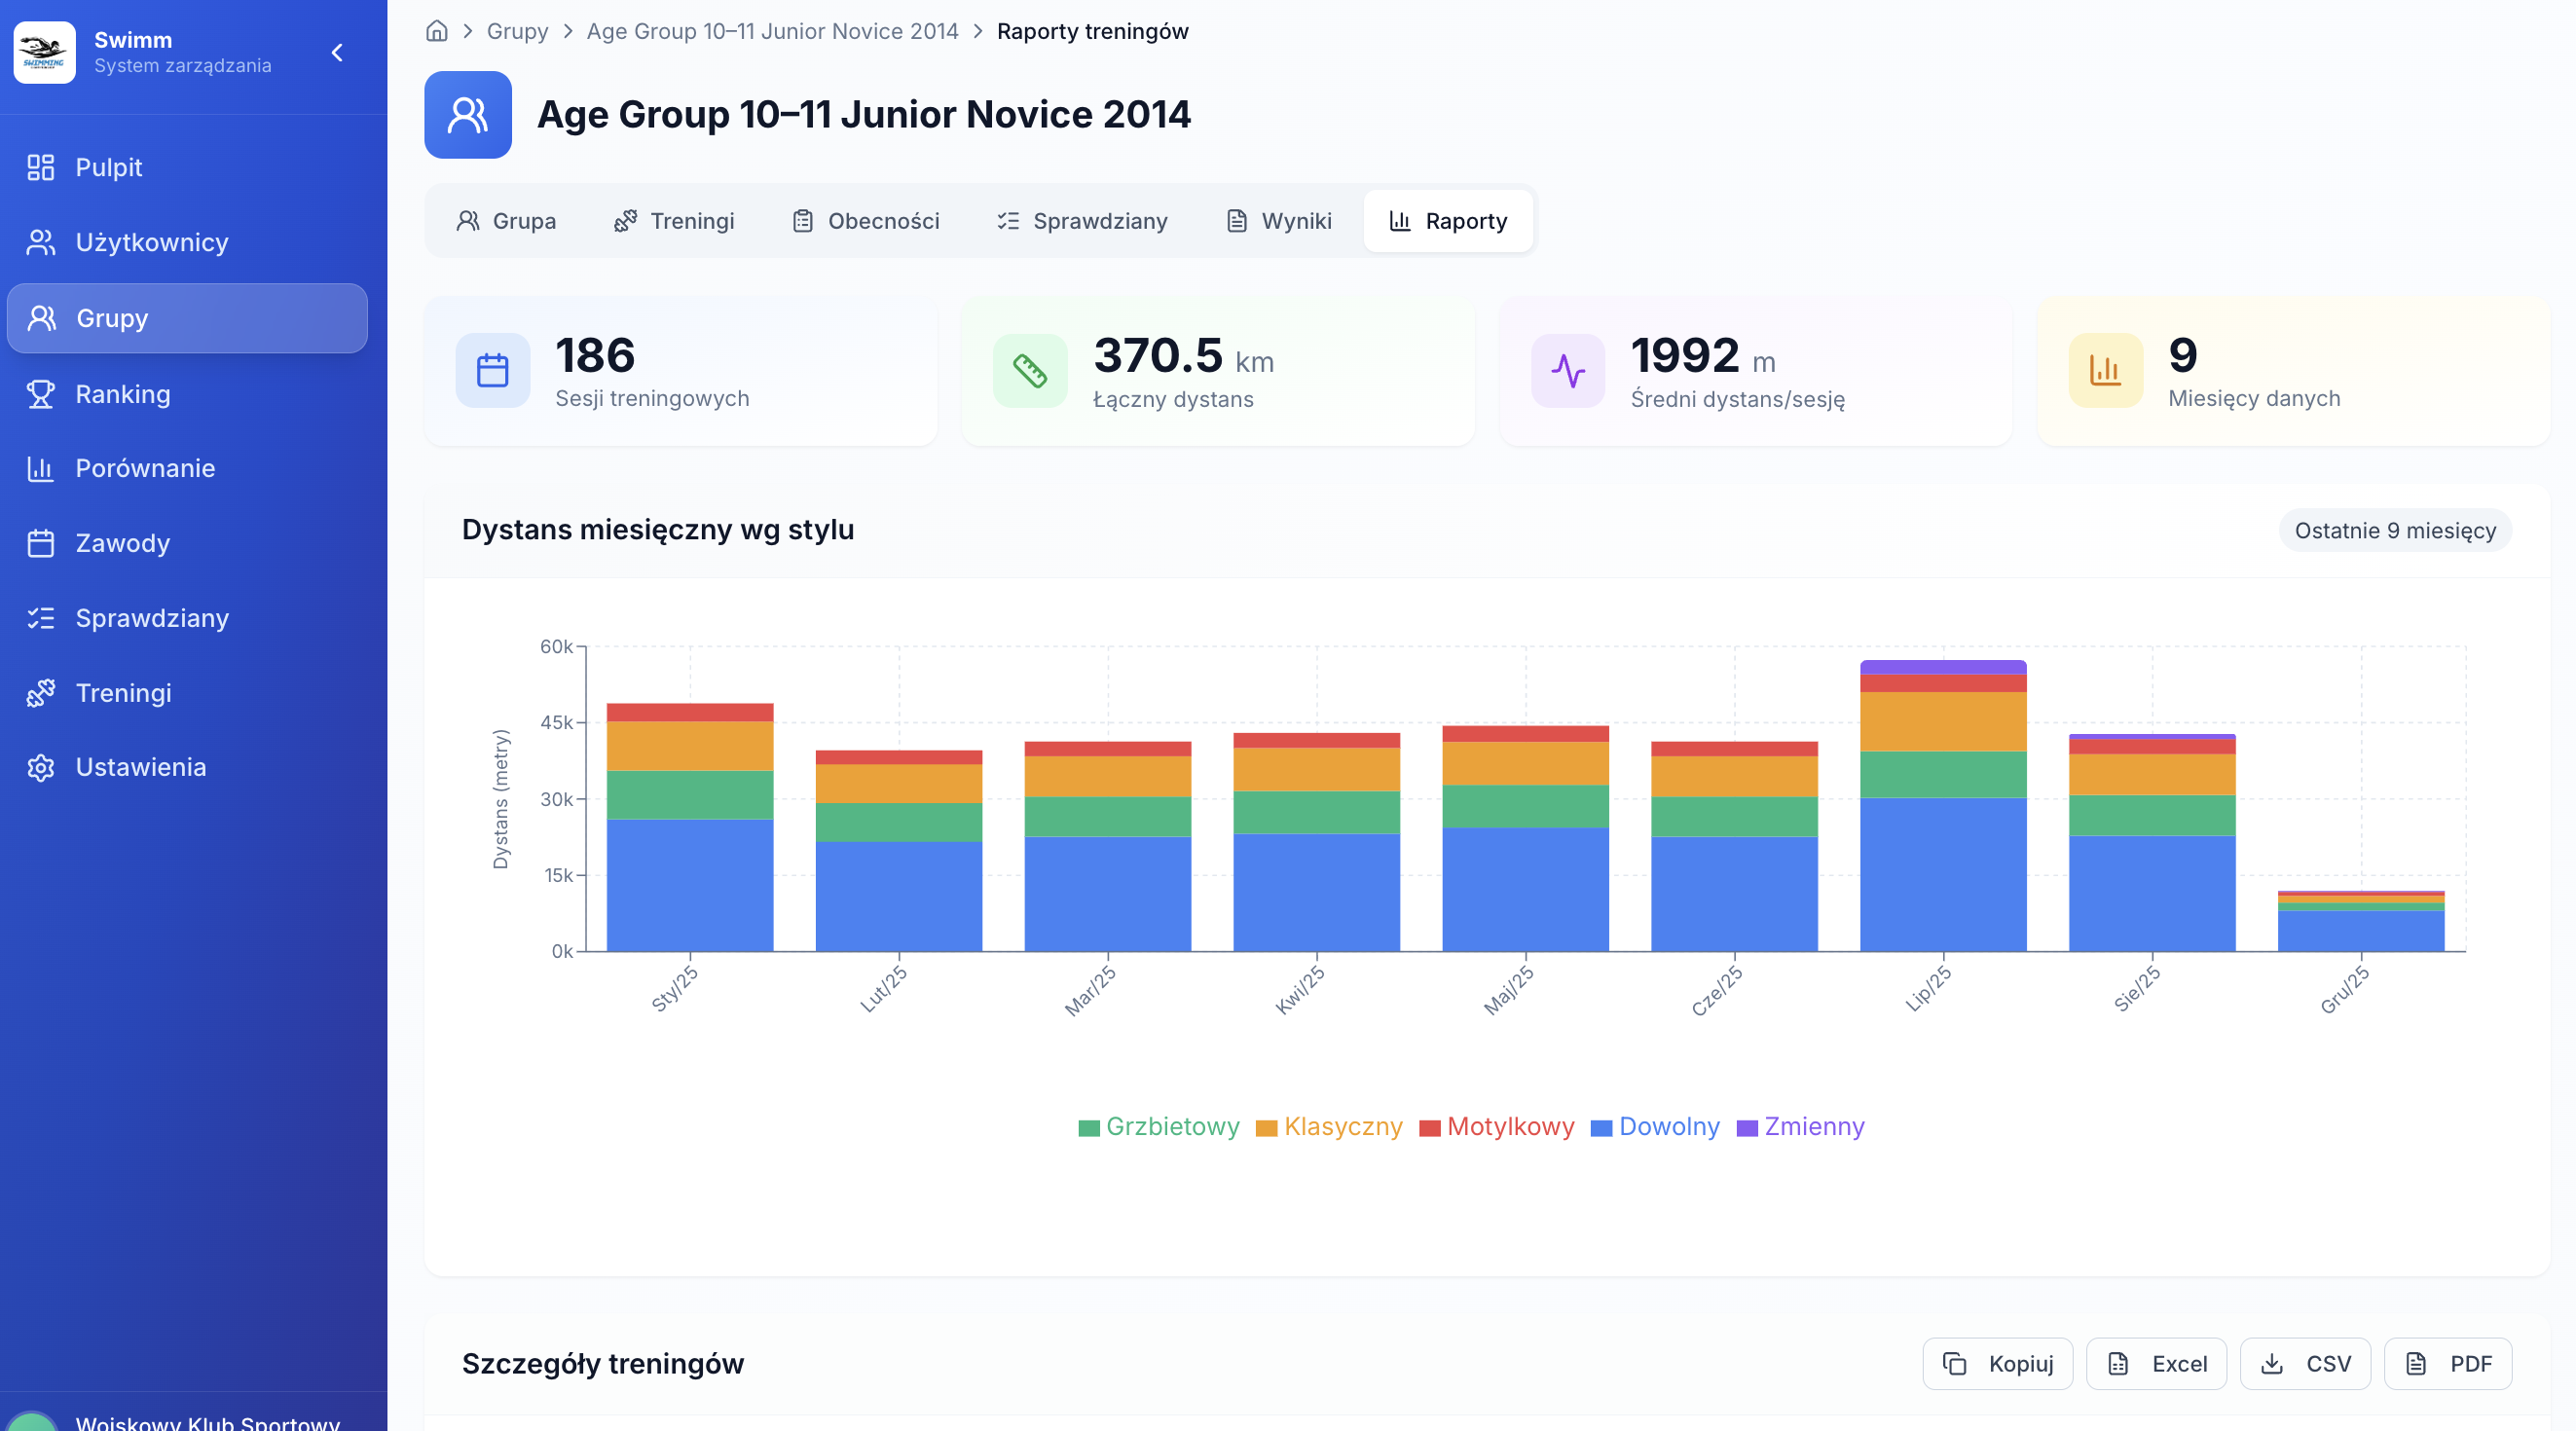
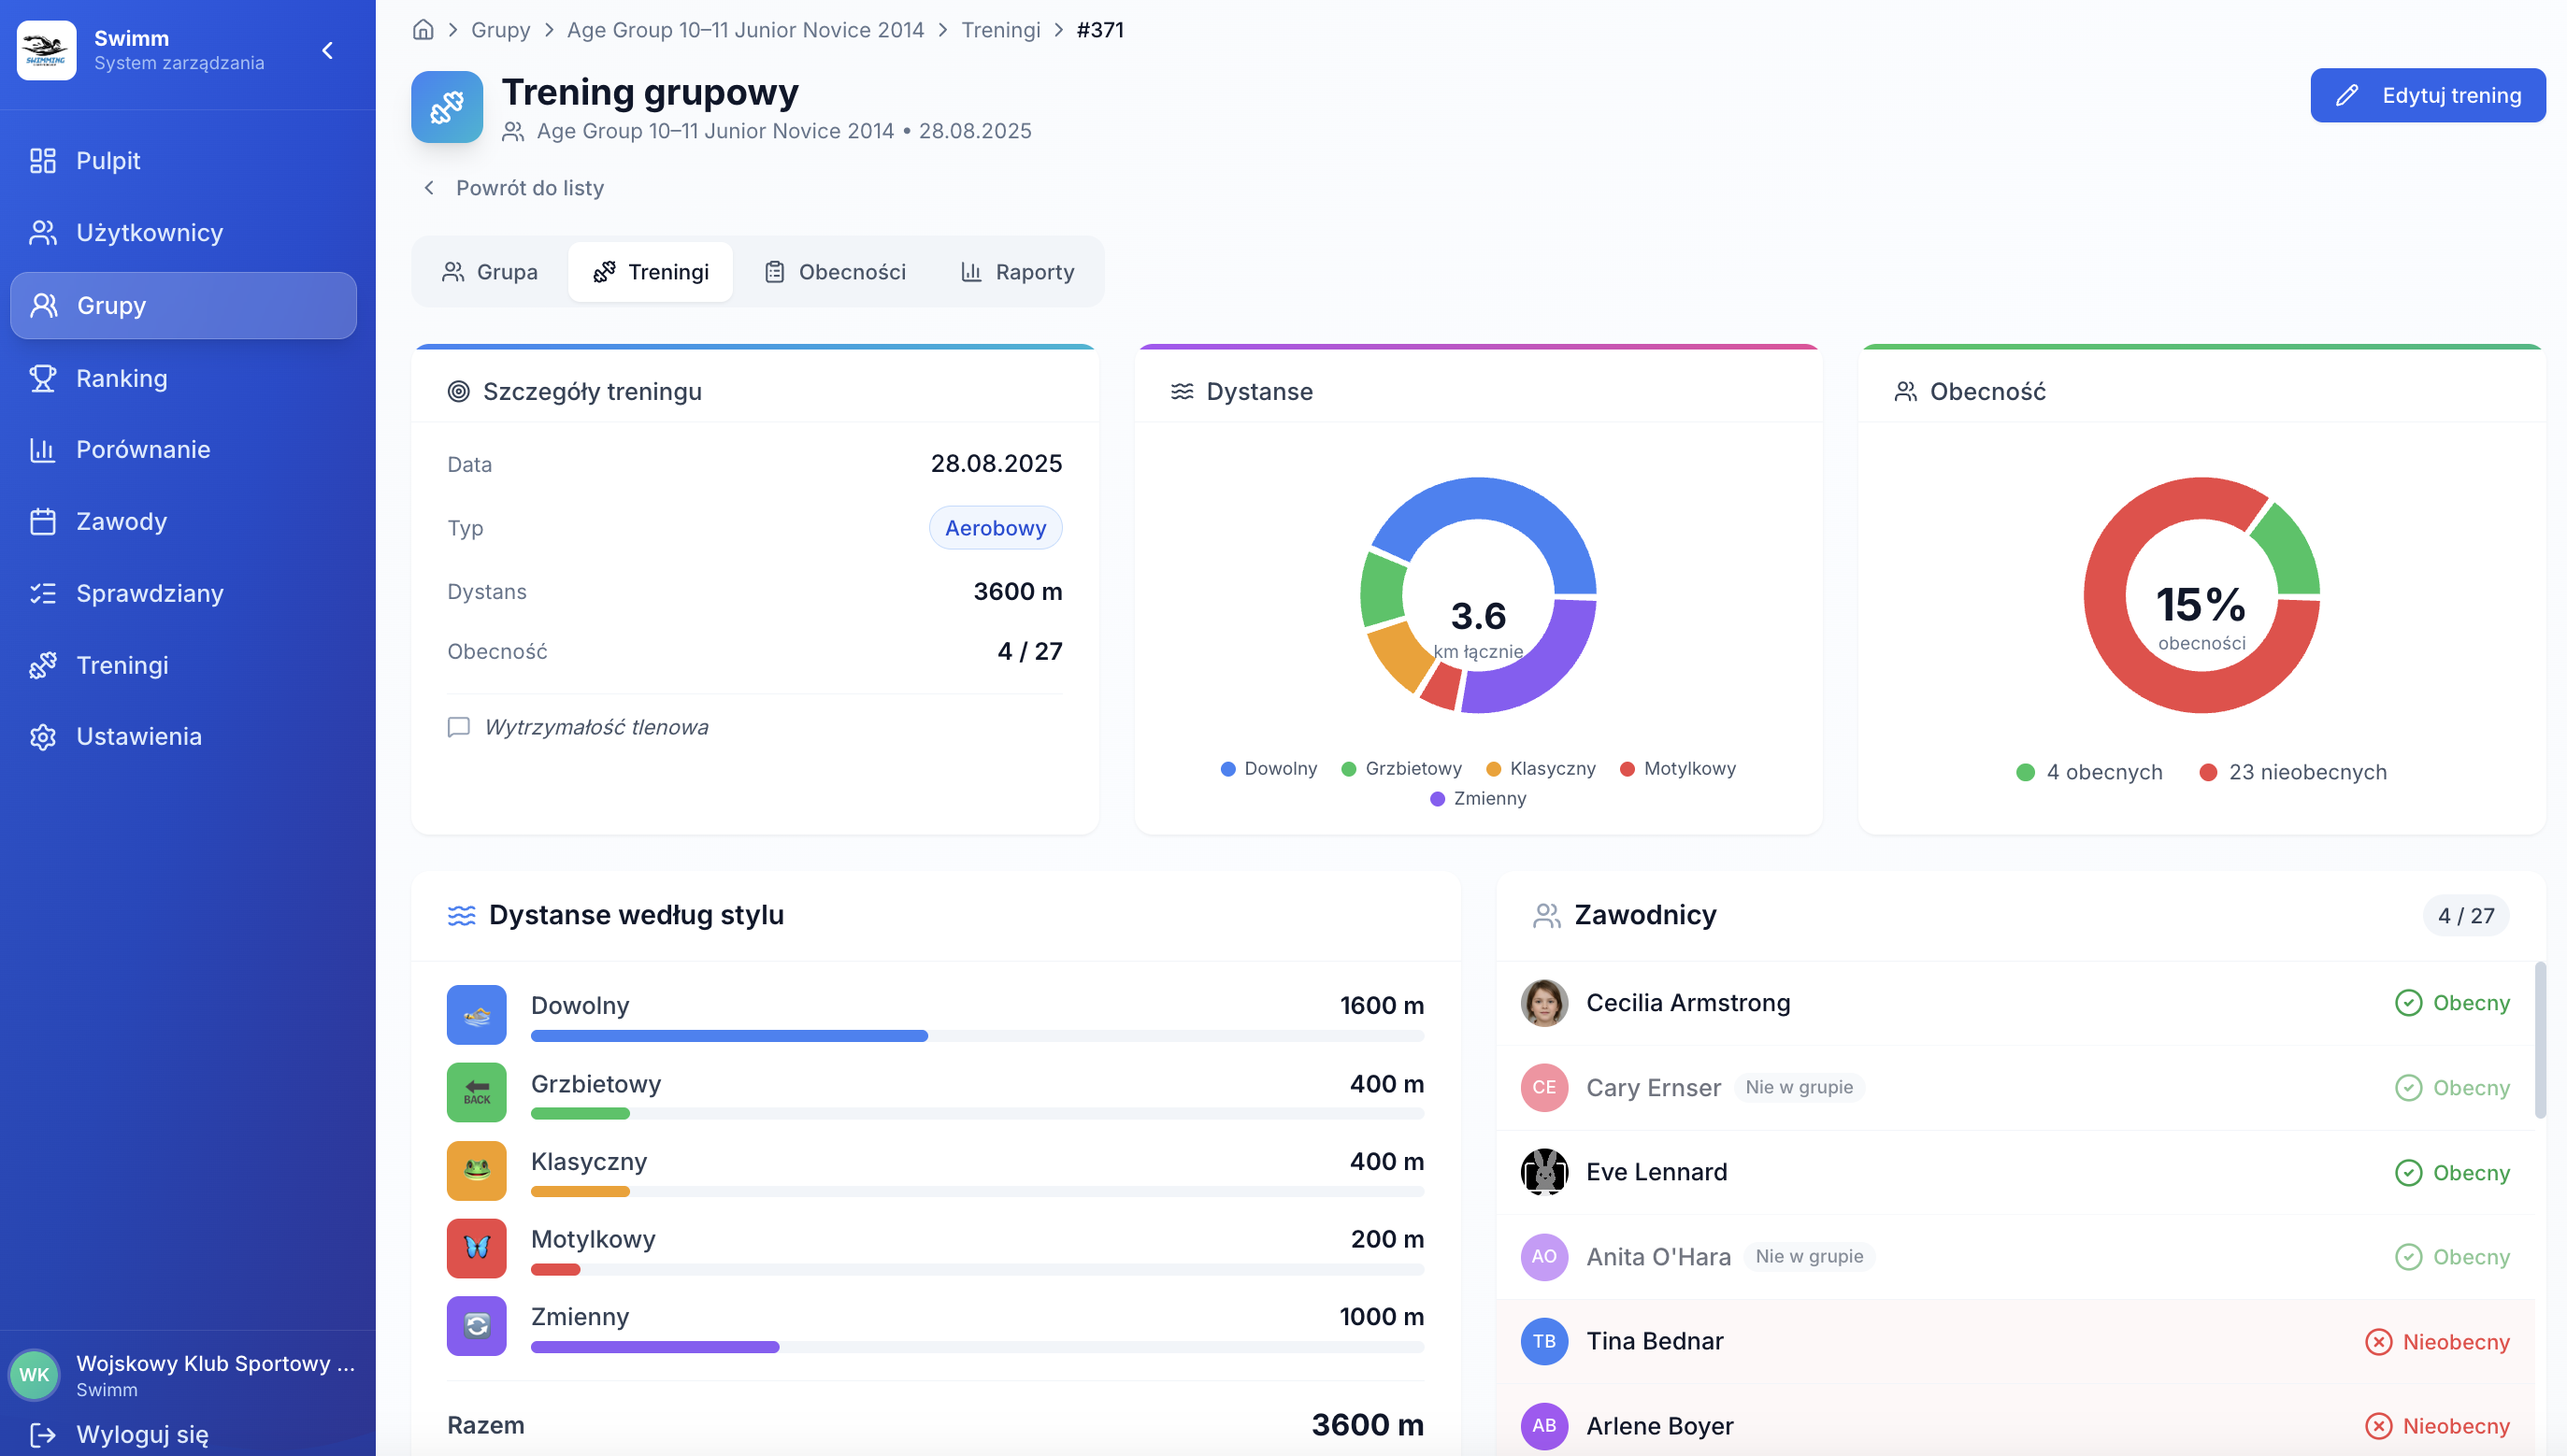
Mileage counted automatically from trainings
A training in Lapsly is not just a note — it is a countable record. You enter stroke distances and the system sums mileage, calculates averages, and shows trends in group and club reports.
- Training type + time of day + notes
- Distances by stroke: free / back / breast / fly / IM
- Total distance + stroke distribution (charts)
- Metrics: number of trainings, total mileage, average distance
In groups
Training list + session details + monthly mileage reports by stroke.
Globally
Global “Trainings” module for the club with filters by group, type, and date range.
Attendance tracking without mental math
Lapsly lets you track attendance monthly — a simple athlete × date table. The system calculates attendance rate and summarizes activity (trainings, meets, tests).
- Attendance table with legend: training / absence / meet / test
- Monthly summaries: trainings, athletes, meets, tests
- Attendance rate calculated automatically
- Who was present/absent for a given training
Coach view
See who skips trainings and when — react faster, not months later.
Club view
Hard data for planning and conversations (workload, regularity, readiness to race).
Screens: attendance
2 screenshots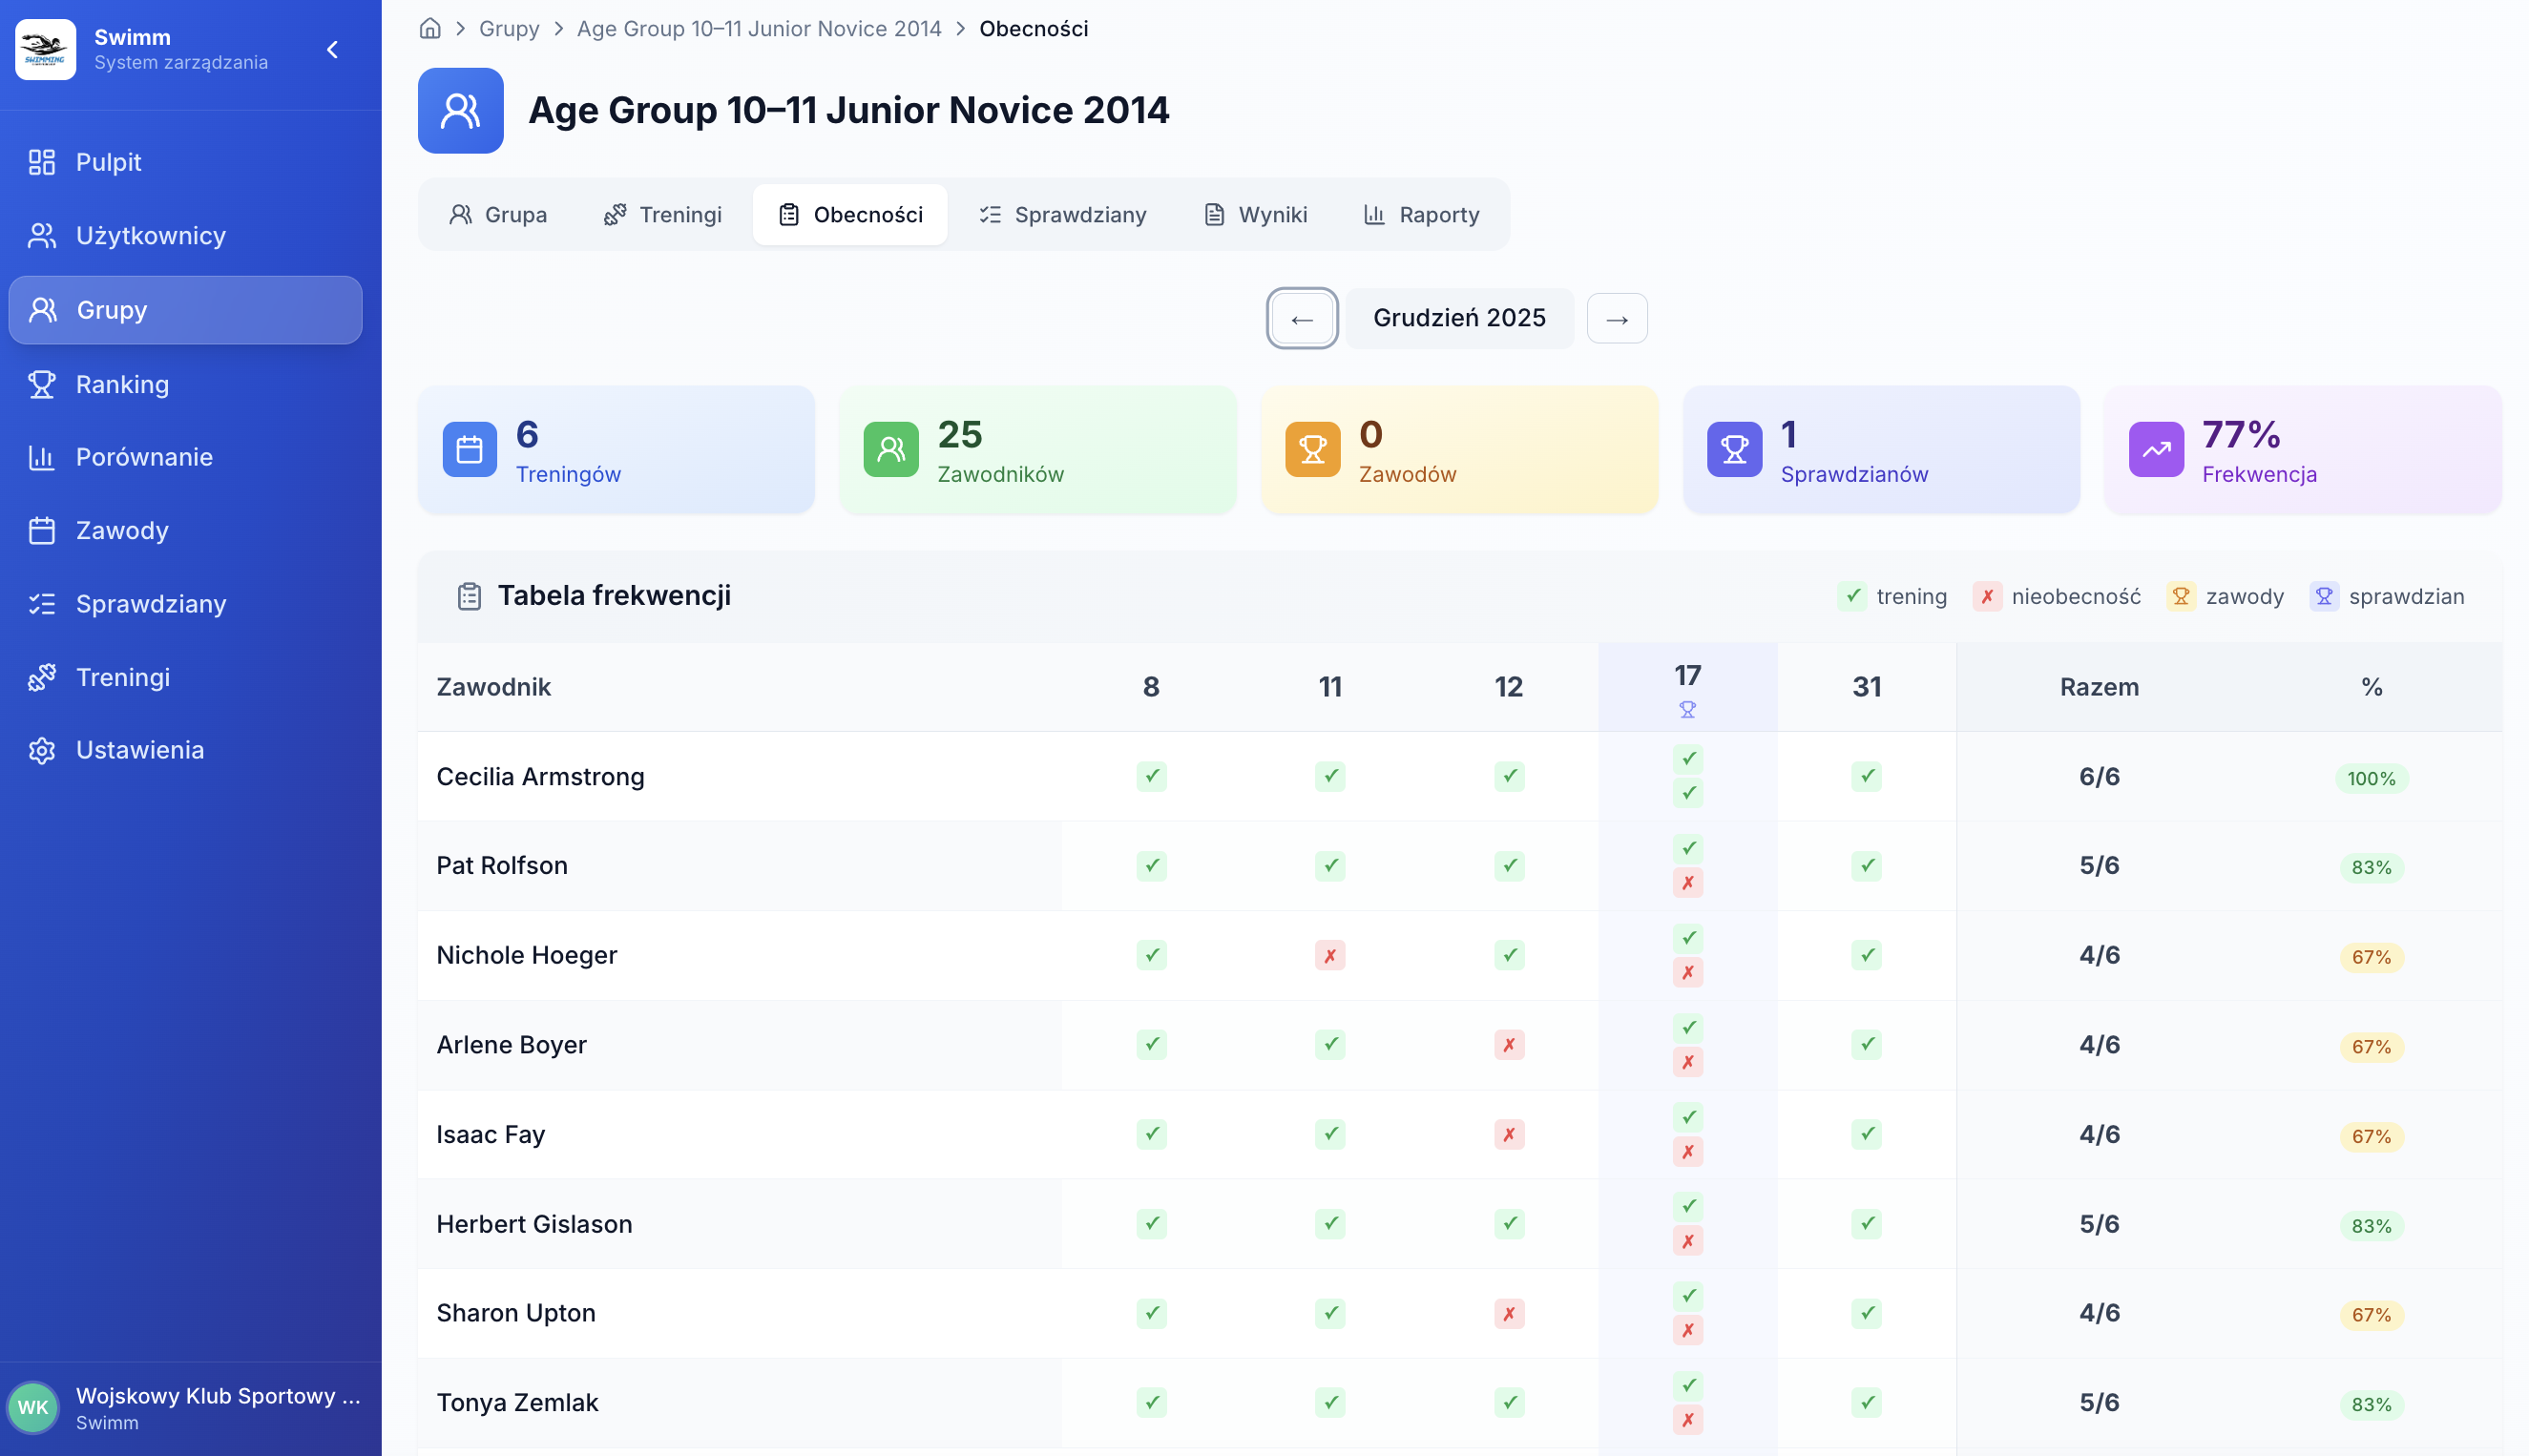
Screens: tests
2 screenshots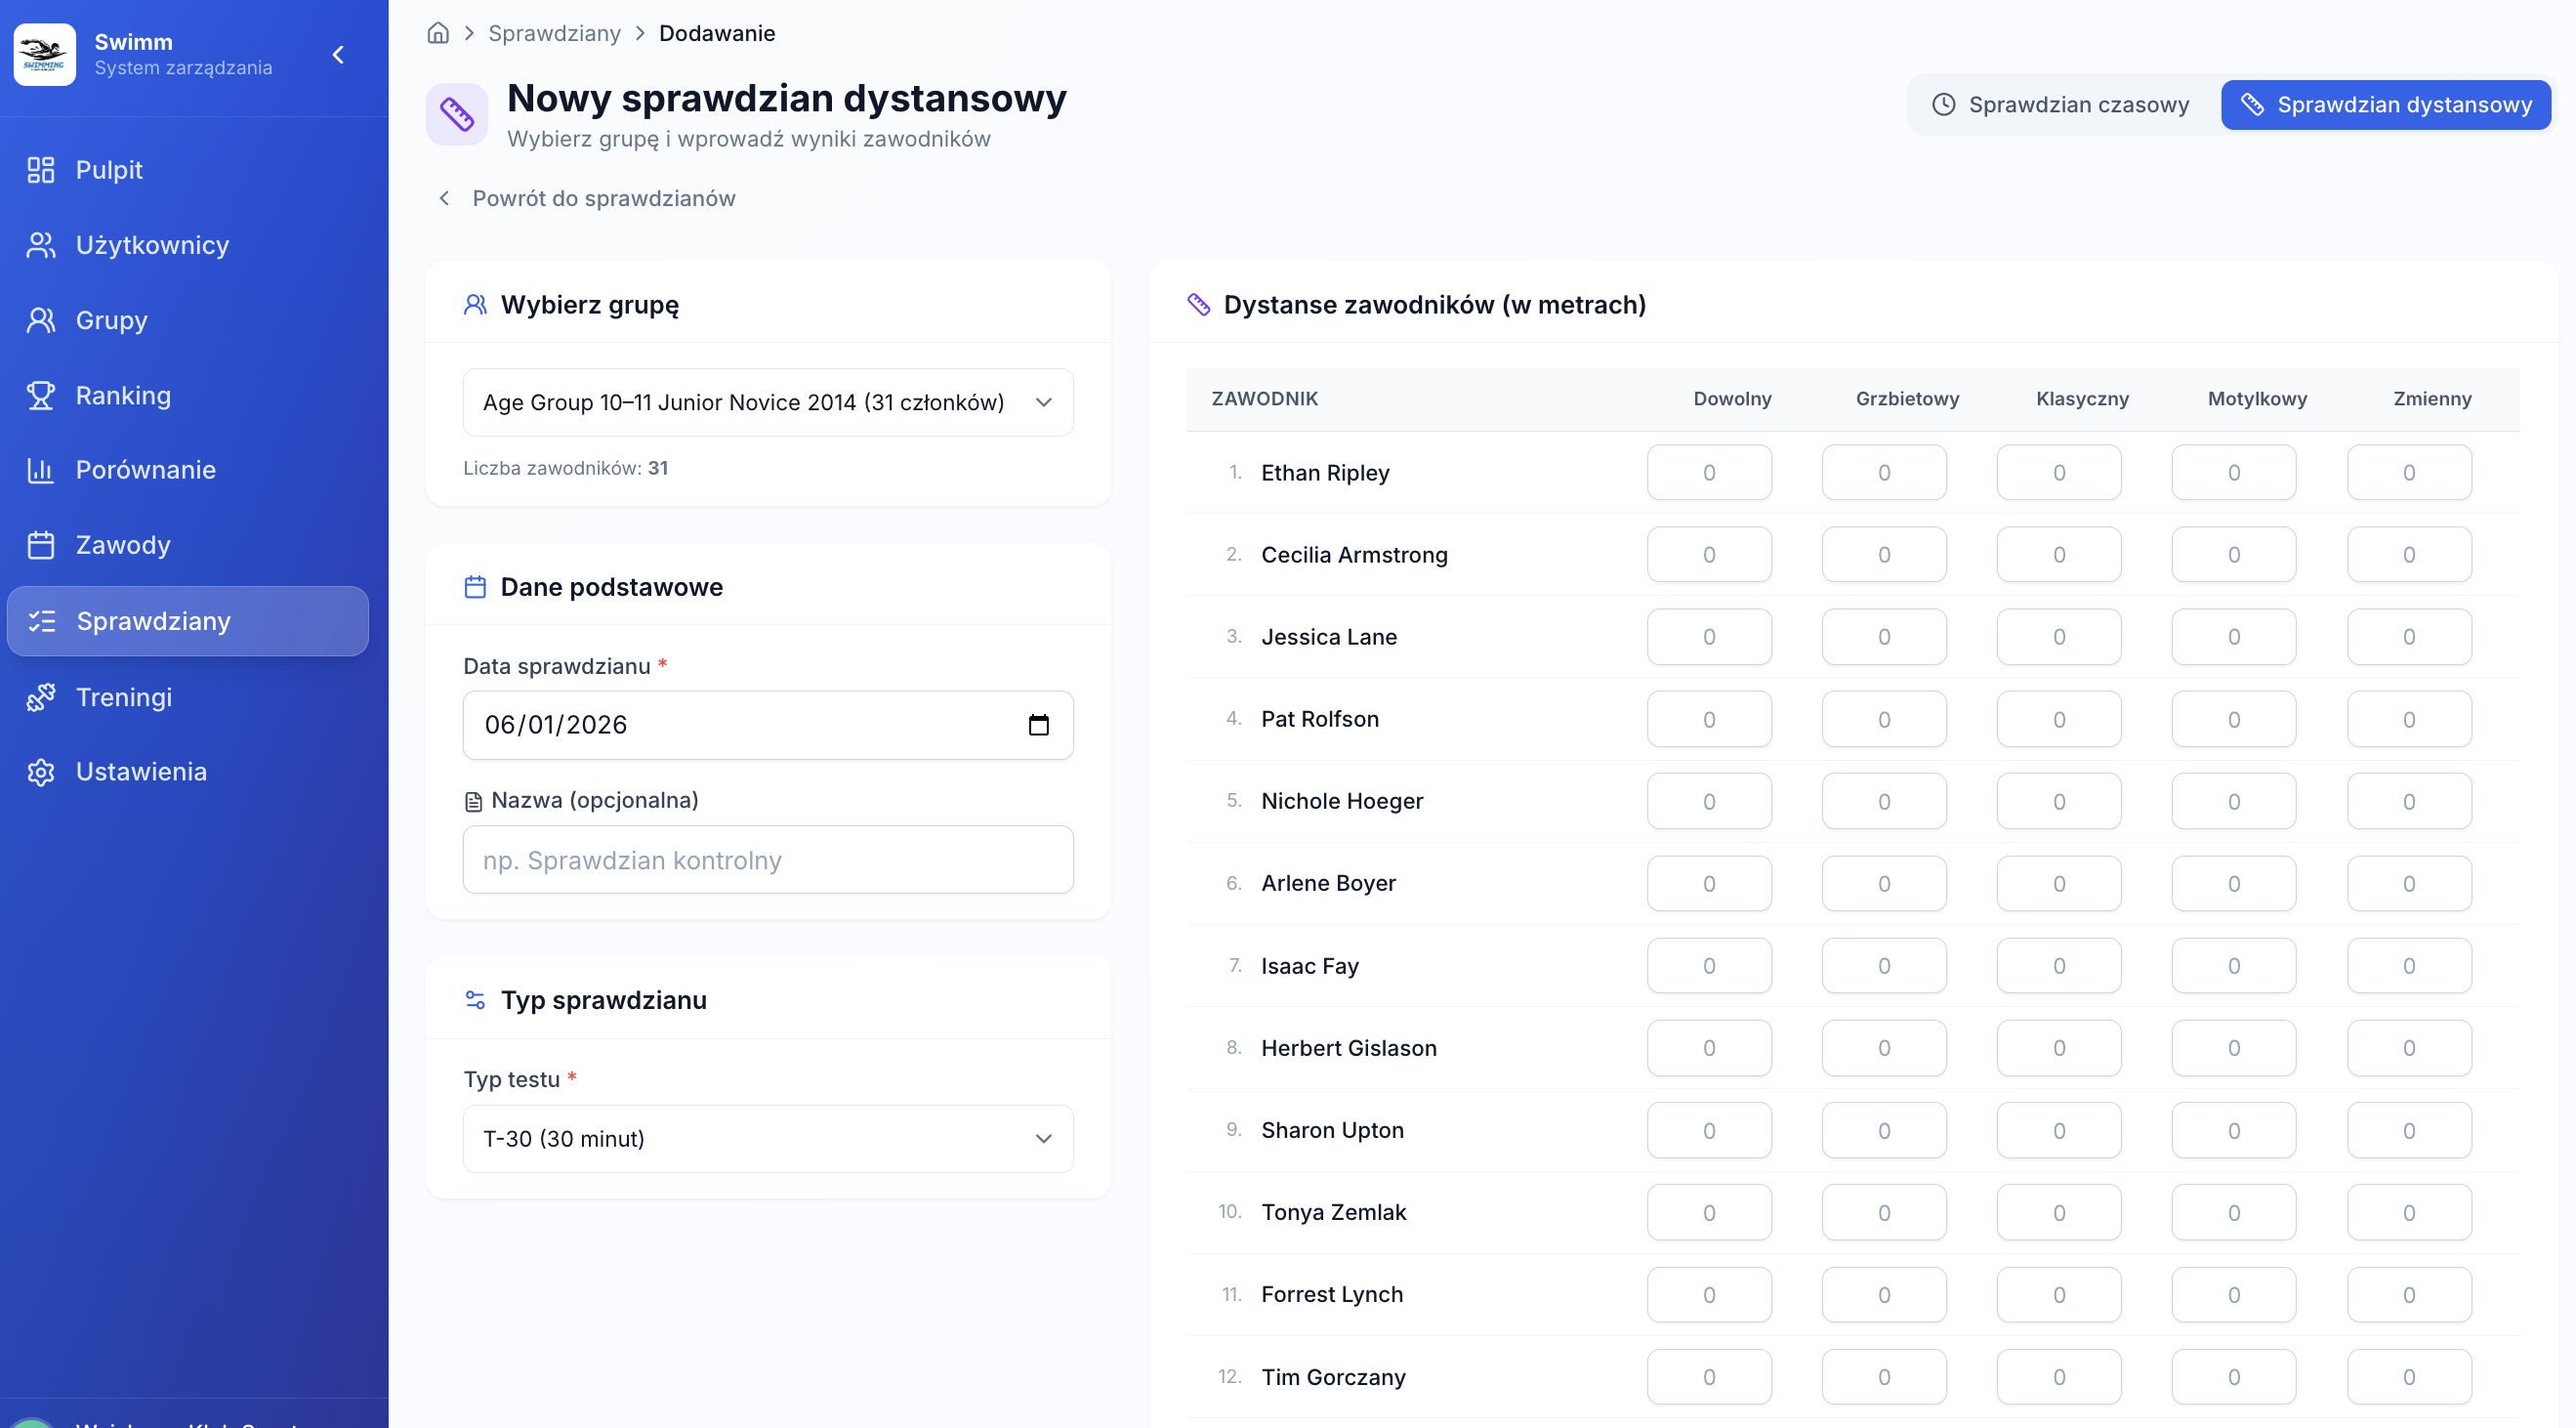
Time and distance tests globally and per group
Tests are available centrally (whole club) and in group tabs. You can manage tests “top-down” or work in the natural context of a specific group.
- Time trials: group, date, stroke, pool + table of athlete times
- Distance tests: T-10 / T-12 / T-20 / T-30
- Filters: name/group, group, test type, date range
- Actions: view, edit, delete — no hunting
Screens: ranking and results
2 screenshots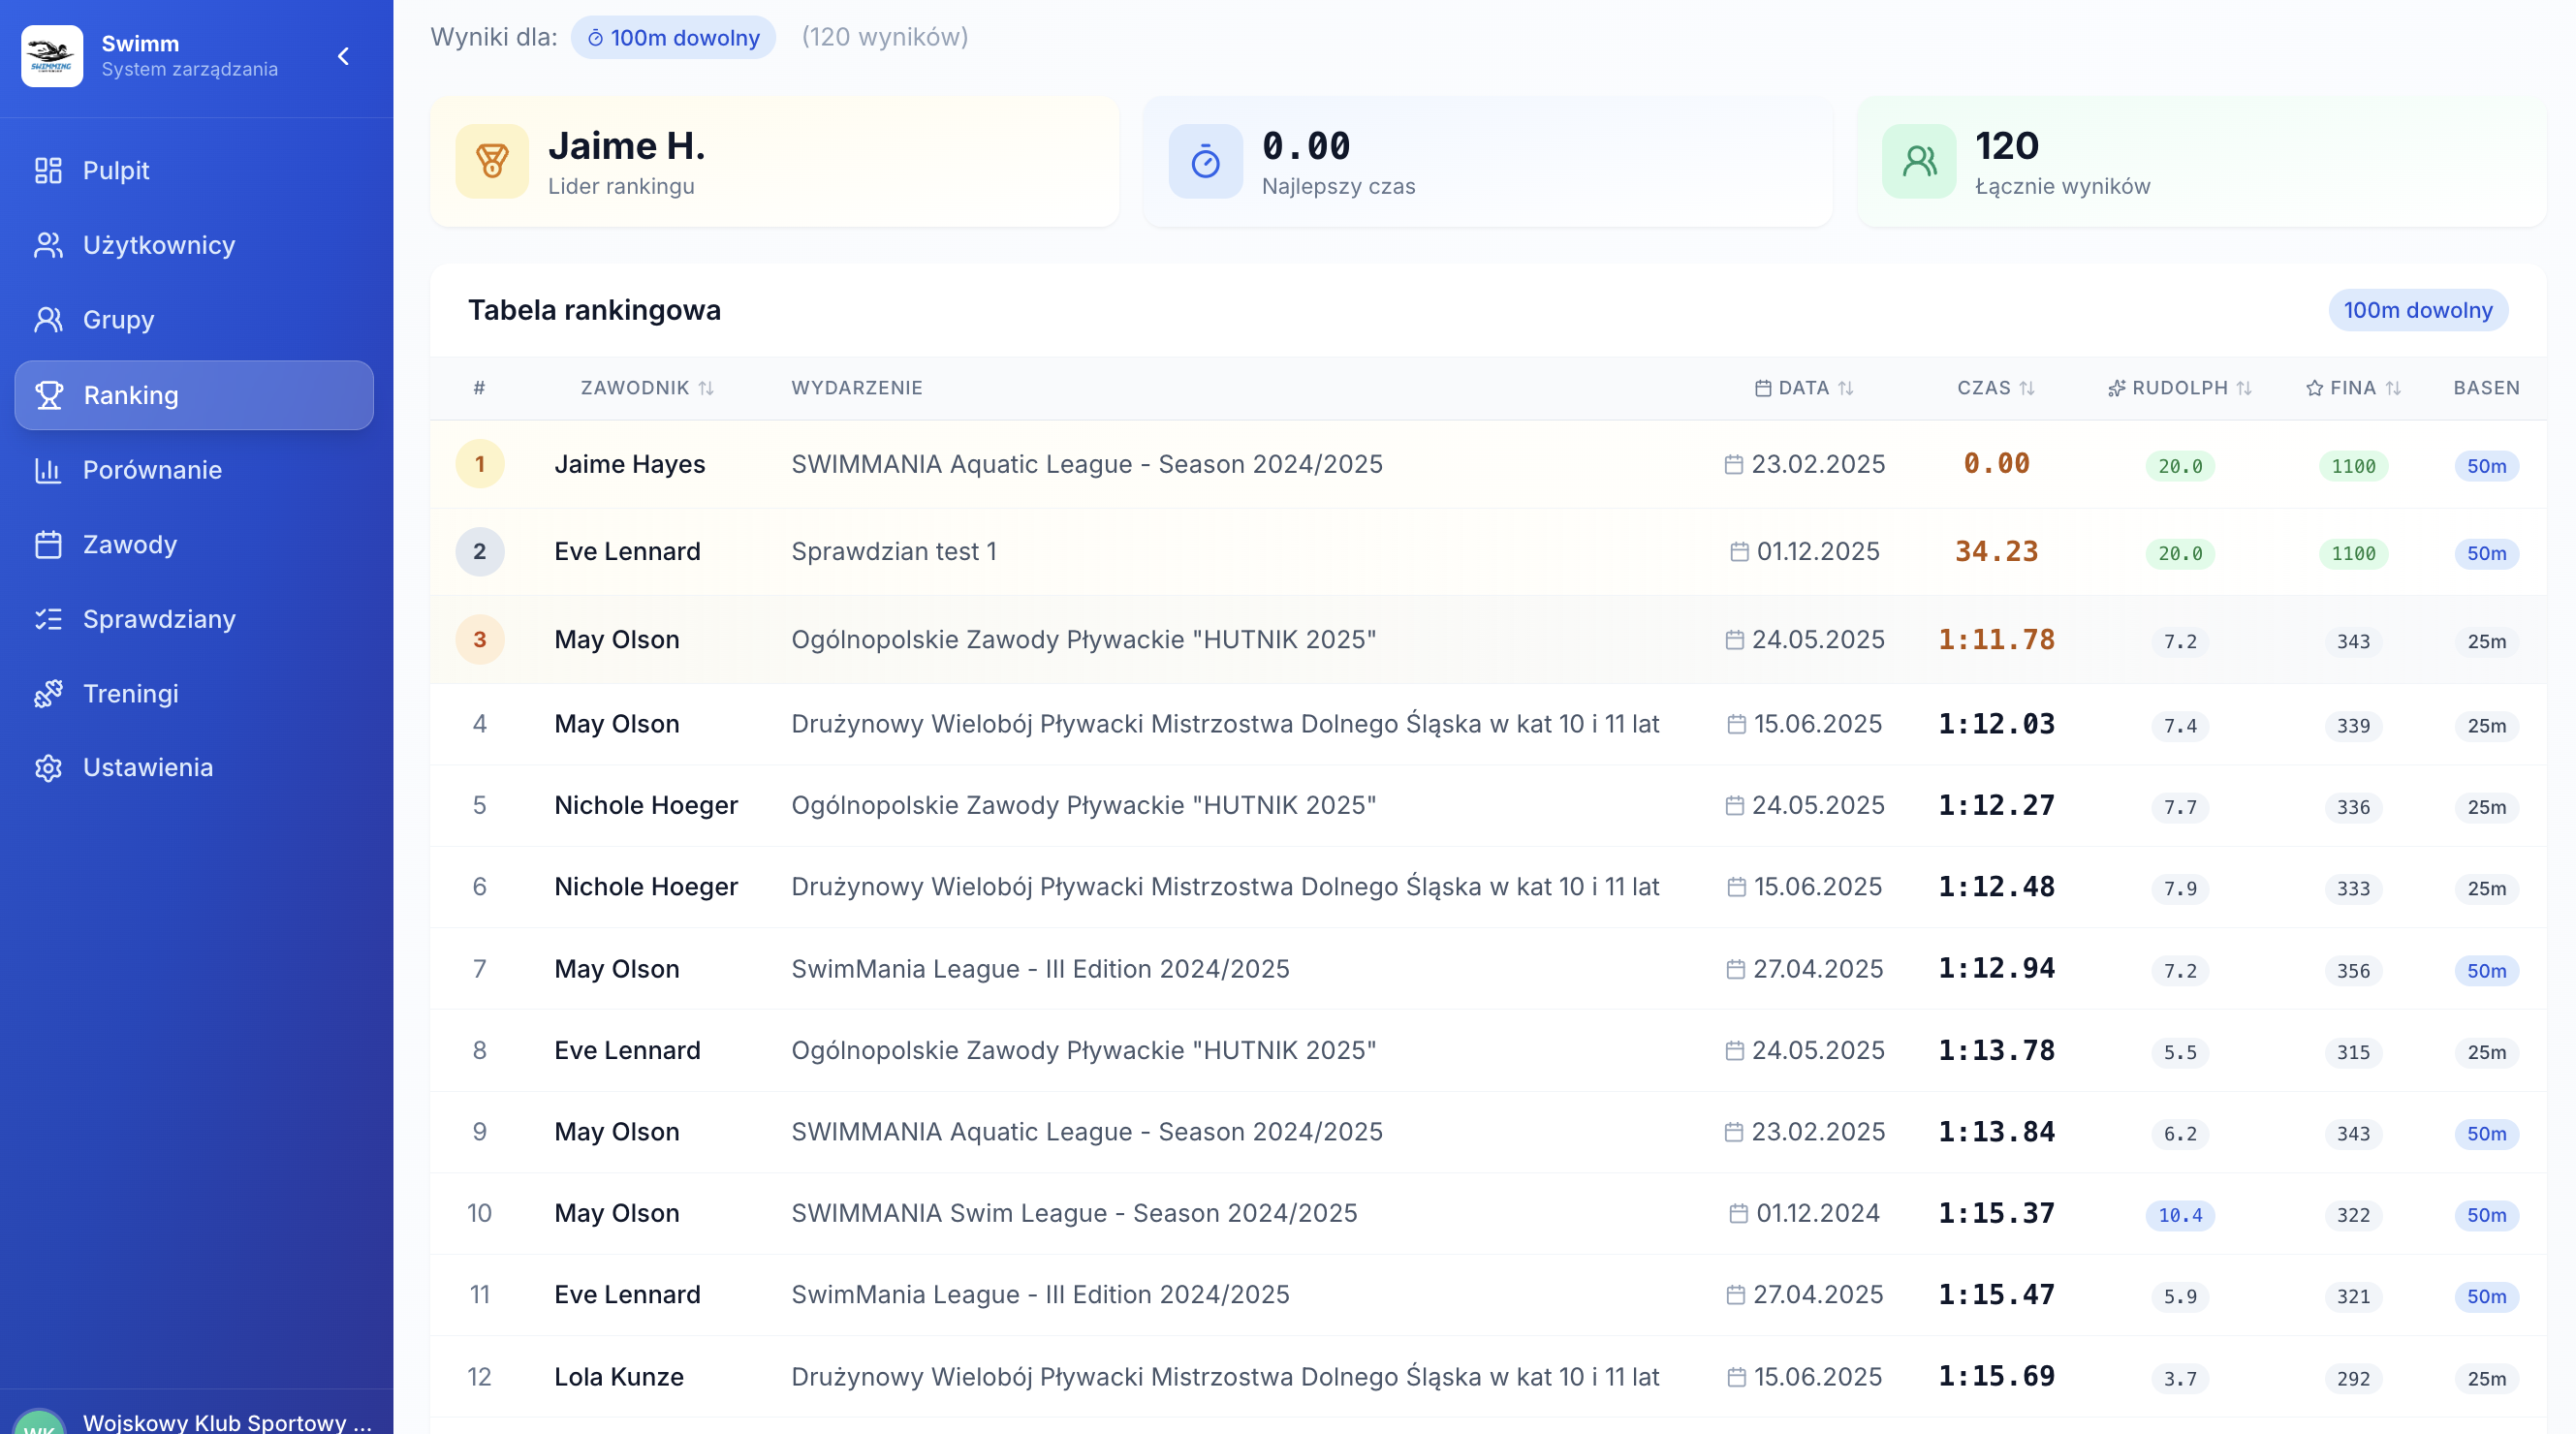
Ranking, points, and filters — one standard
Ranking lets you choose stroke, pool, group, and dates, then shows best times and points. You can also add a result manually if you need to fill historical gaps.
- Filters: stroke / pool / group + advanced dates
- Metrics: leader, best time, number of matching results
- Ranking table: athlete, event, date, time, points
- Add result manually: stroke, pool, date, meet + athlete times
2–6 athletes, PBs and filters — fast coaching decisions
Comparison is built for coaches: pick athletes from a group, set filters, and immediately see PB differences. Perfect for lane planning, set design, and progress communication.
- Athlete selection (modal) + selection counter
- Filters: stroke / pool / date range
- PB table: strokes in rows, athletes in columns
- Add more / clear comparison
Screens: comparison
2 screenshots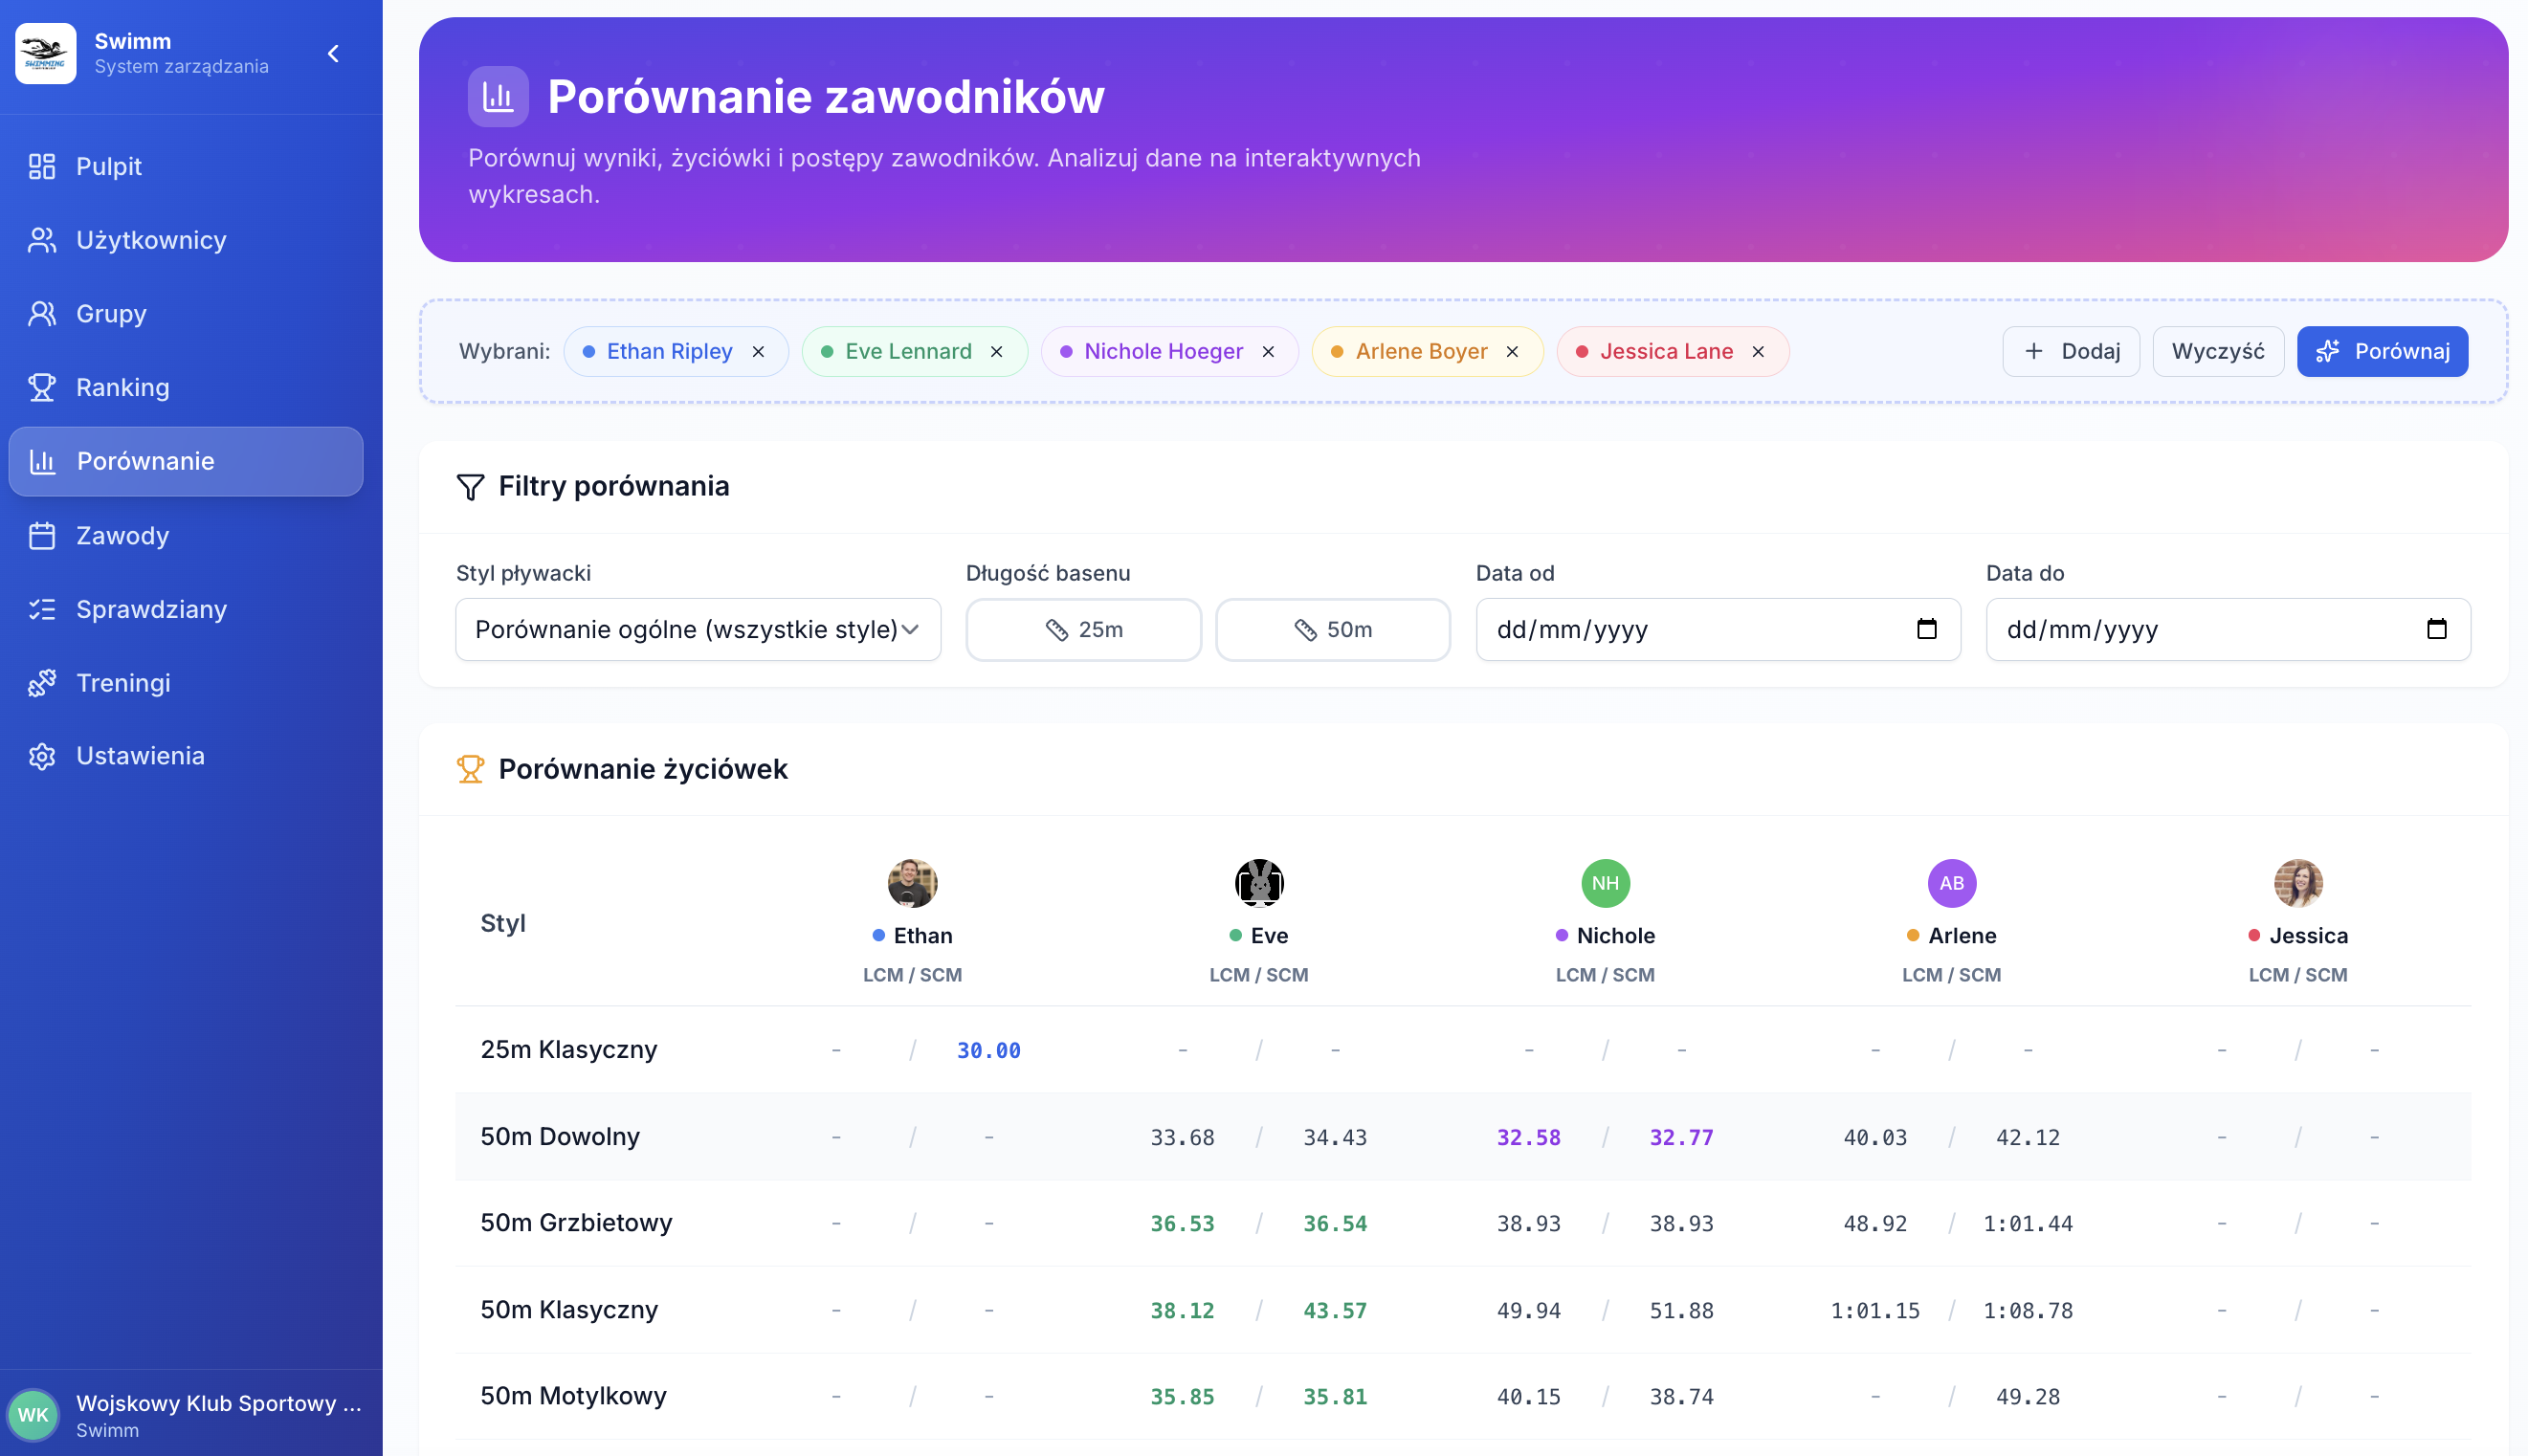
Screens: events and LENEX
2 screenshots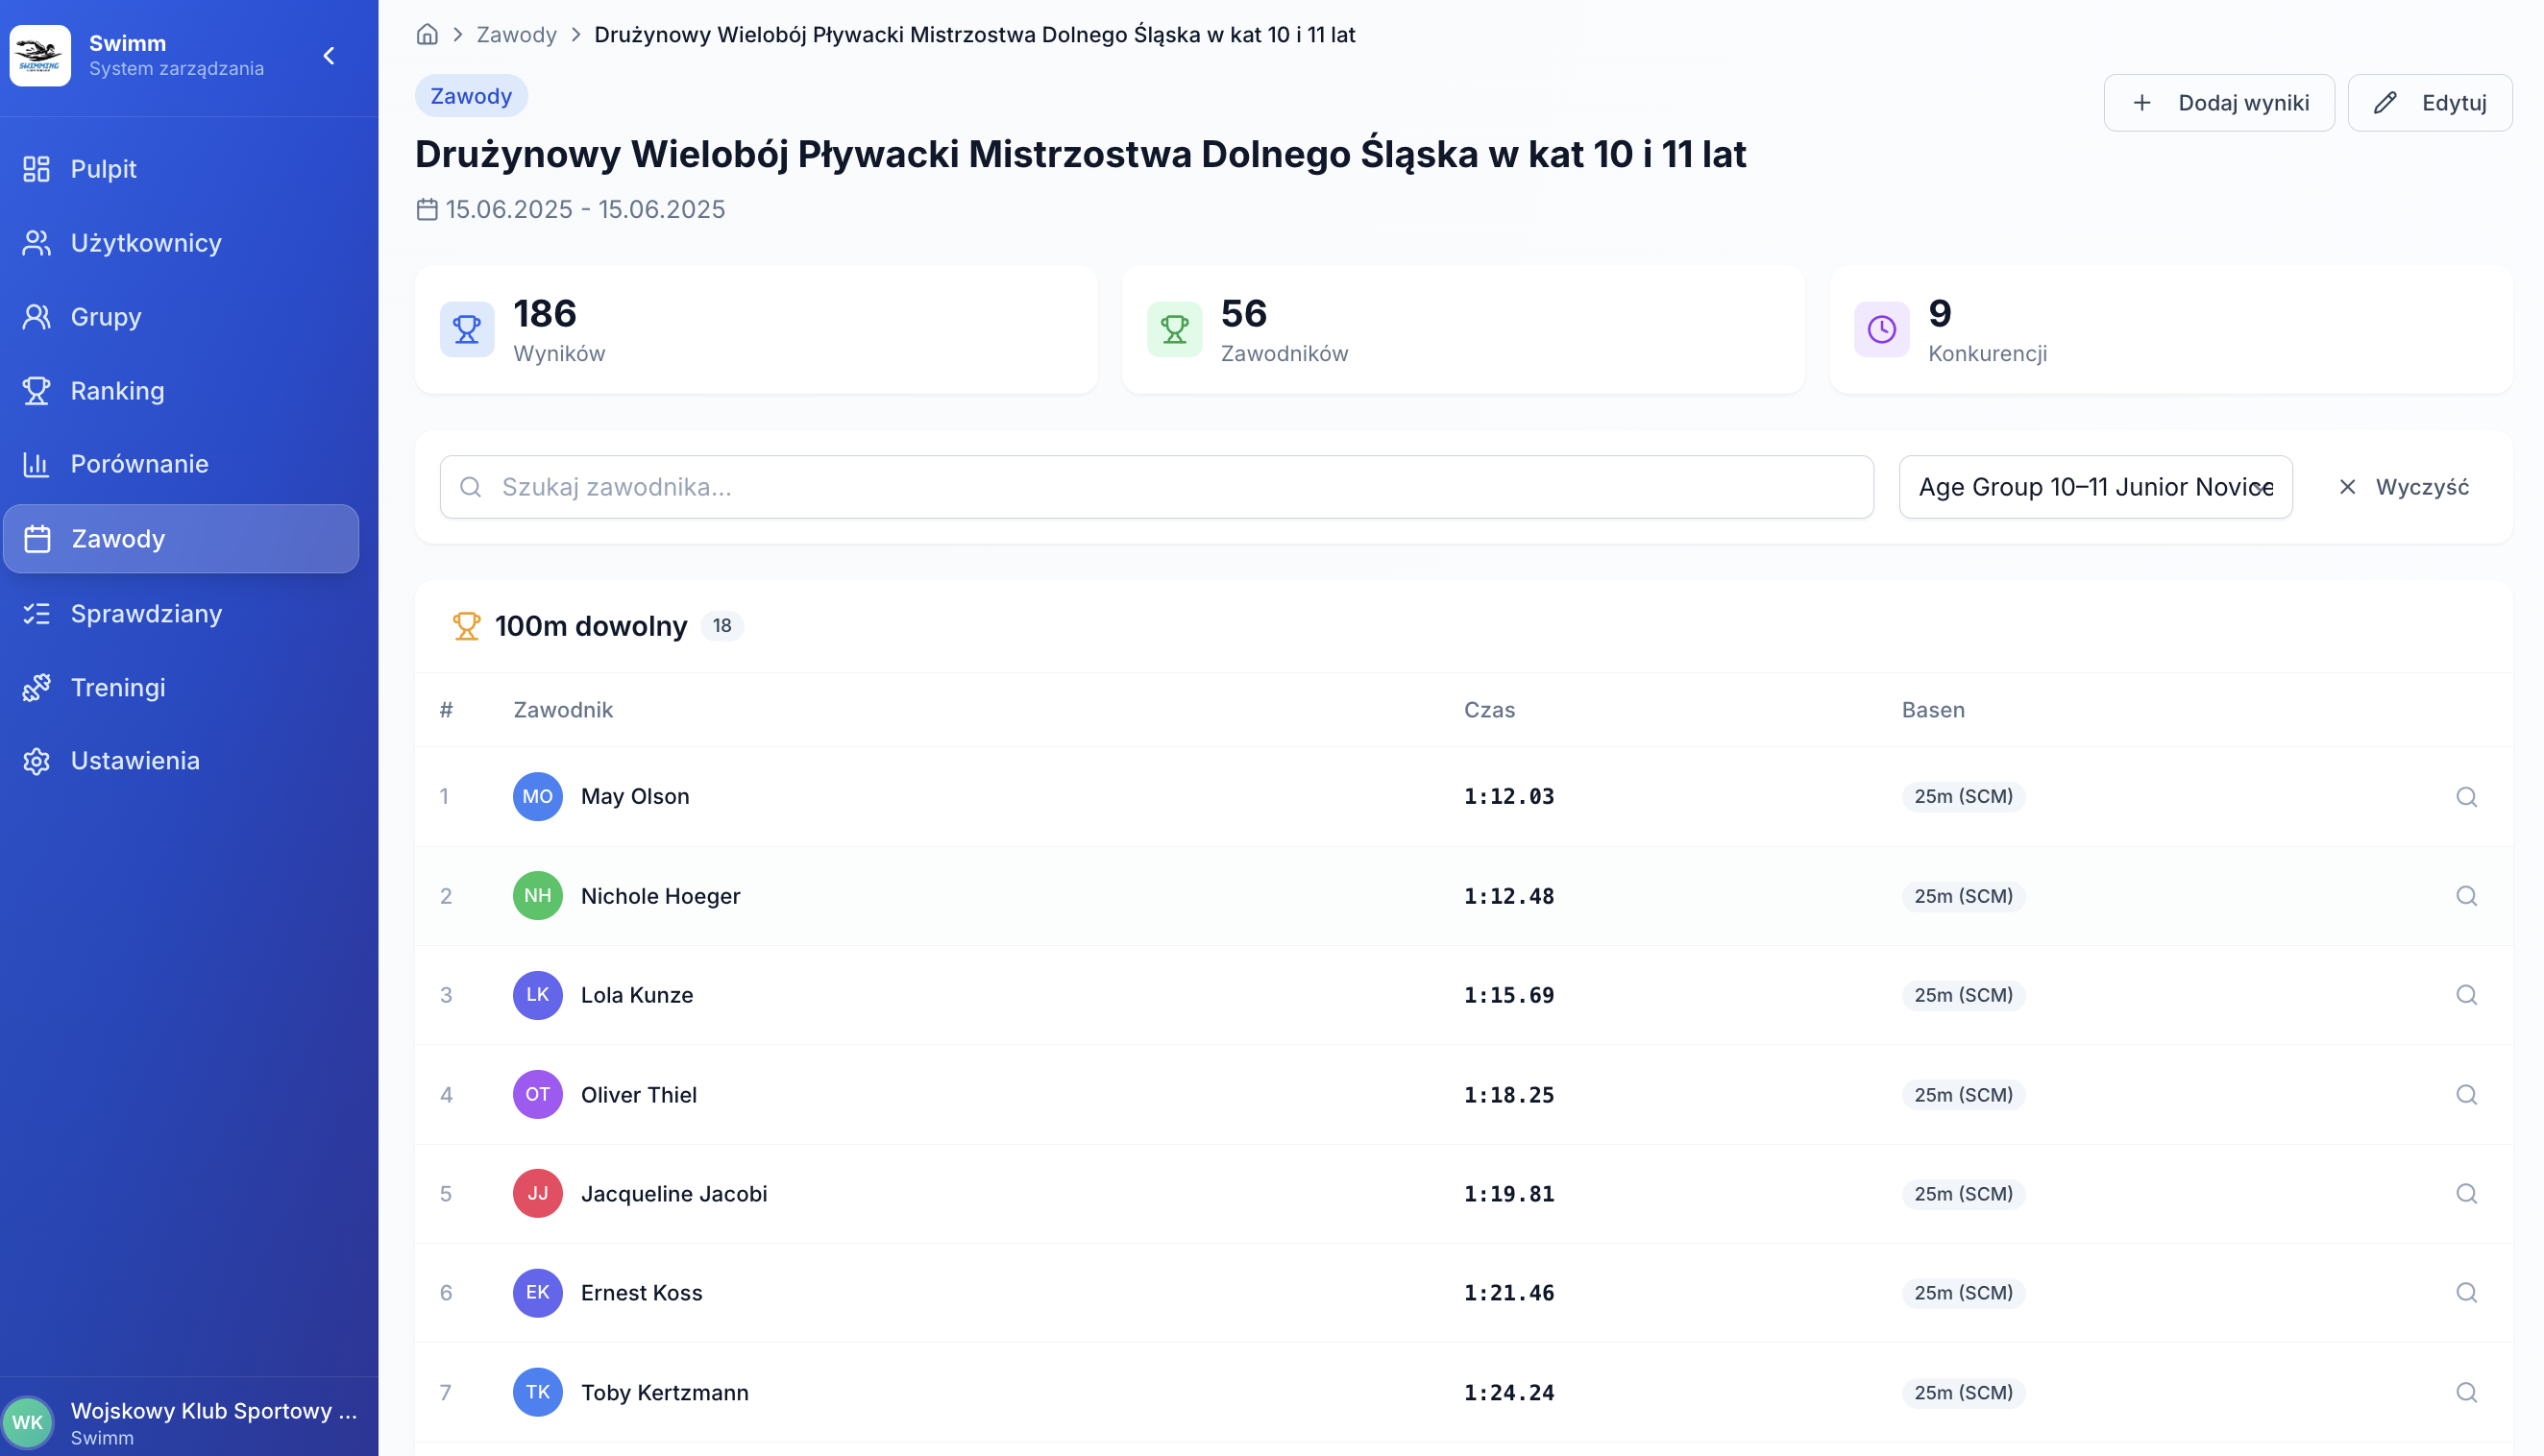
Seasoned events + LENEX result import
Meets in Lapsly are organized by season and include clear metrics. Inside you see events, races, and rankings, and LENEX import quickly feeds official results.
- Events list: type, dates, location, results count
- Details: metrics + event sections with rankings
- LENEX import: .lxf / .lef / .xml (drag and drop)
Attendance + mileage + results — in group and club reports
Reports are built from training and attendance data. You see activity, monthly mileage, stroke distribution, and detailed tables. When needed — export to CSV/Excel/PDF.
- Monthly distance by stroke (chart) + training table
- Summaries: session count, total distance, average per training
- Group results: average/median/record + top athletes
- Export: Copy / CSV / Excel / PDF
Screens: reports
2 screenshots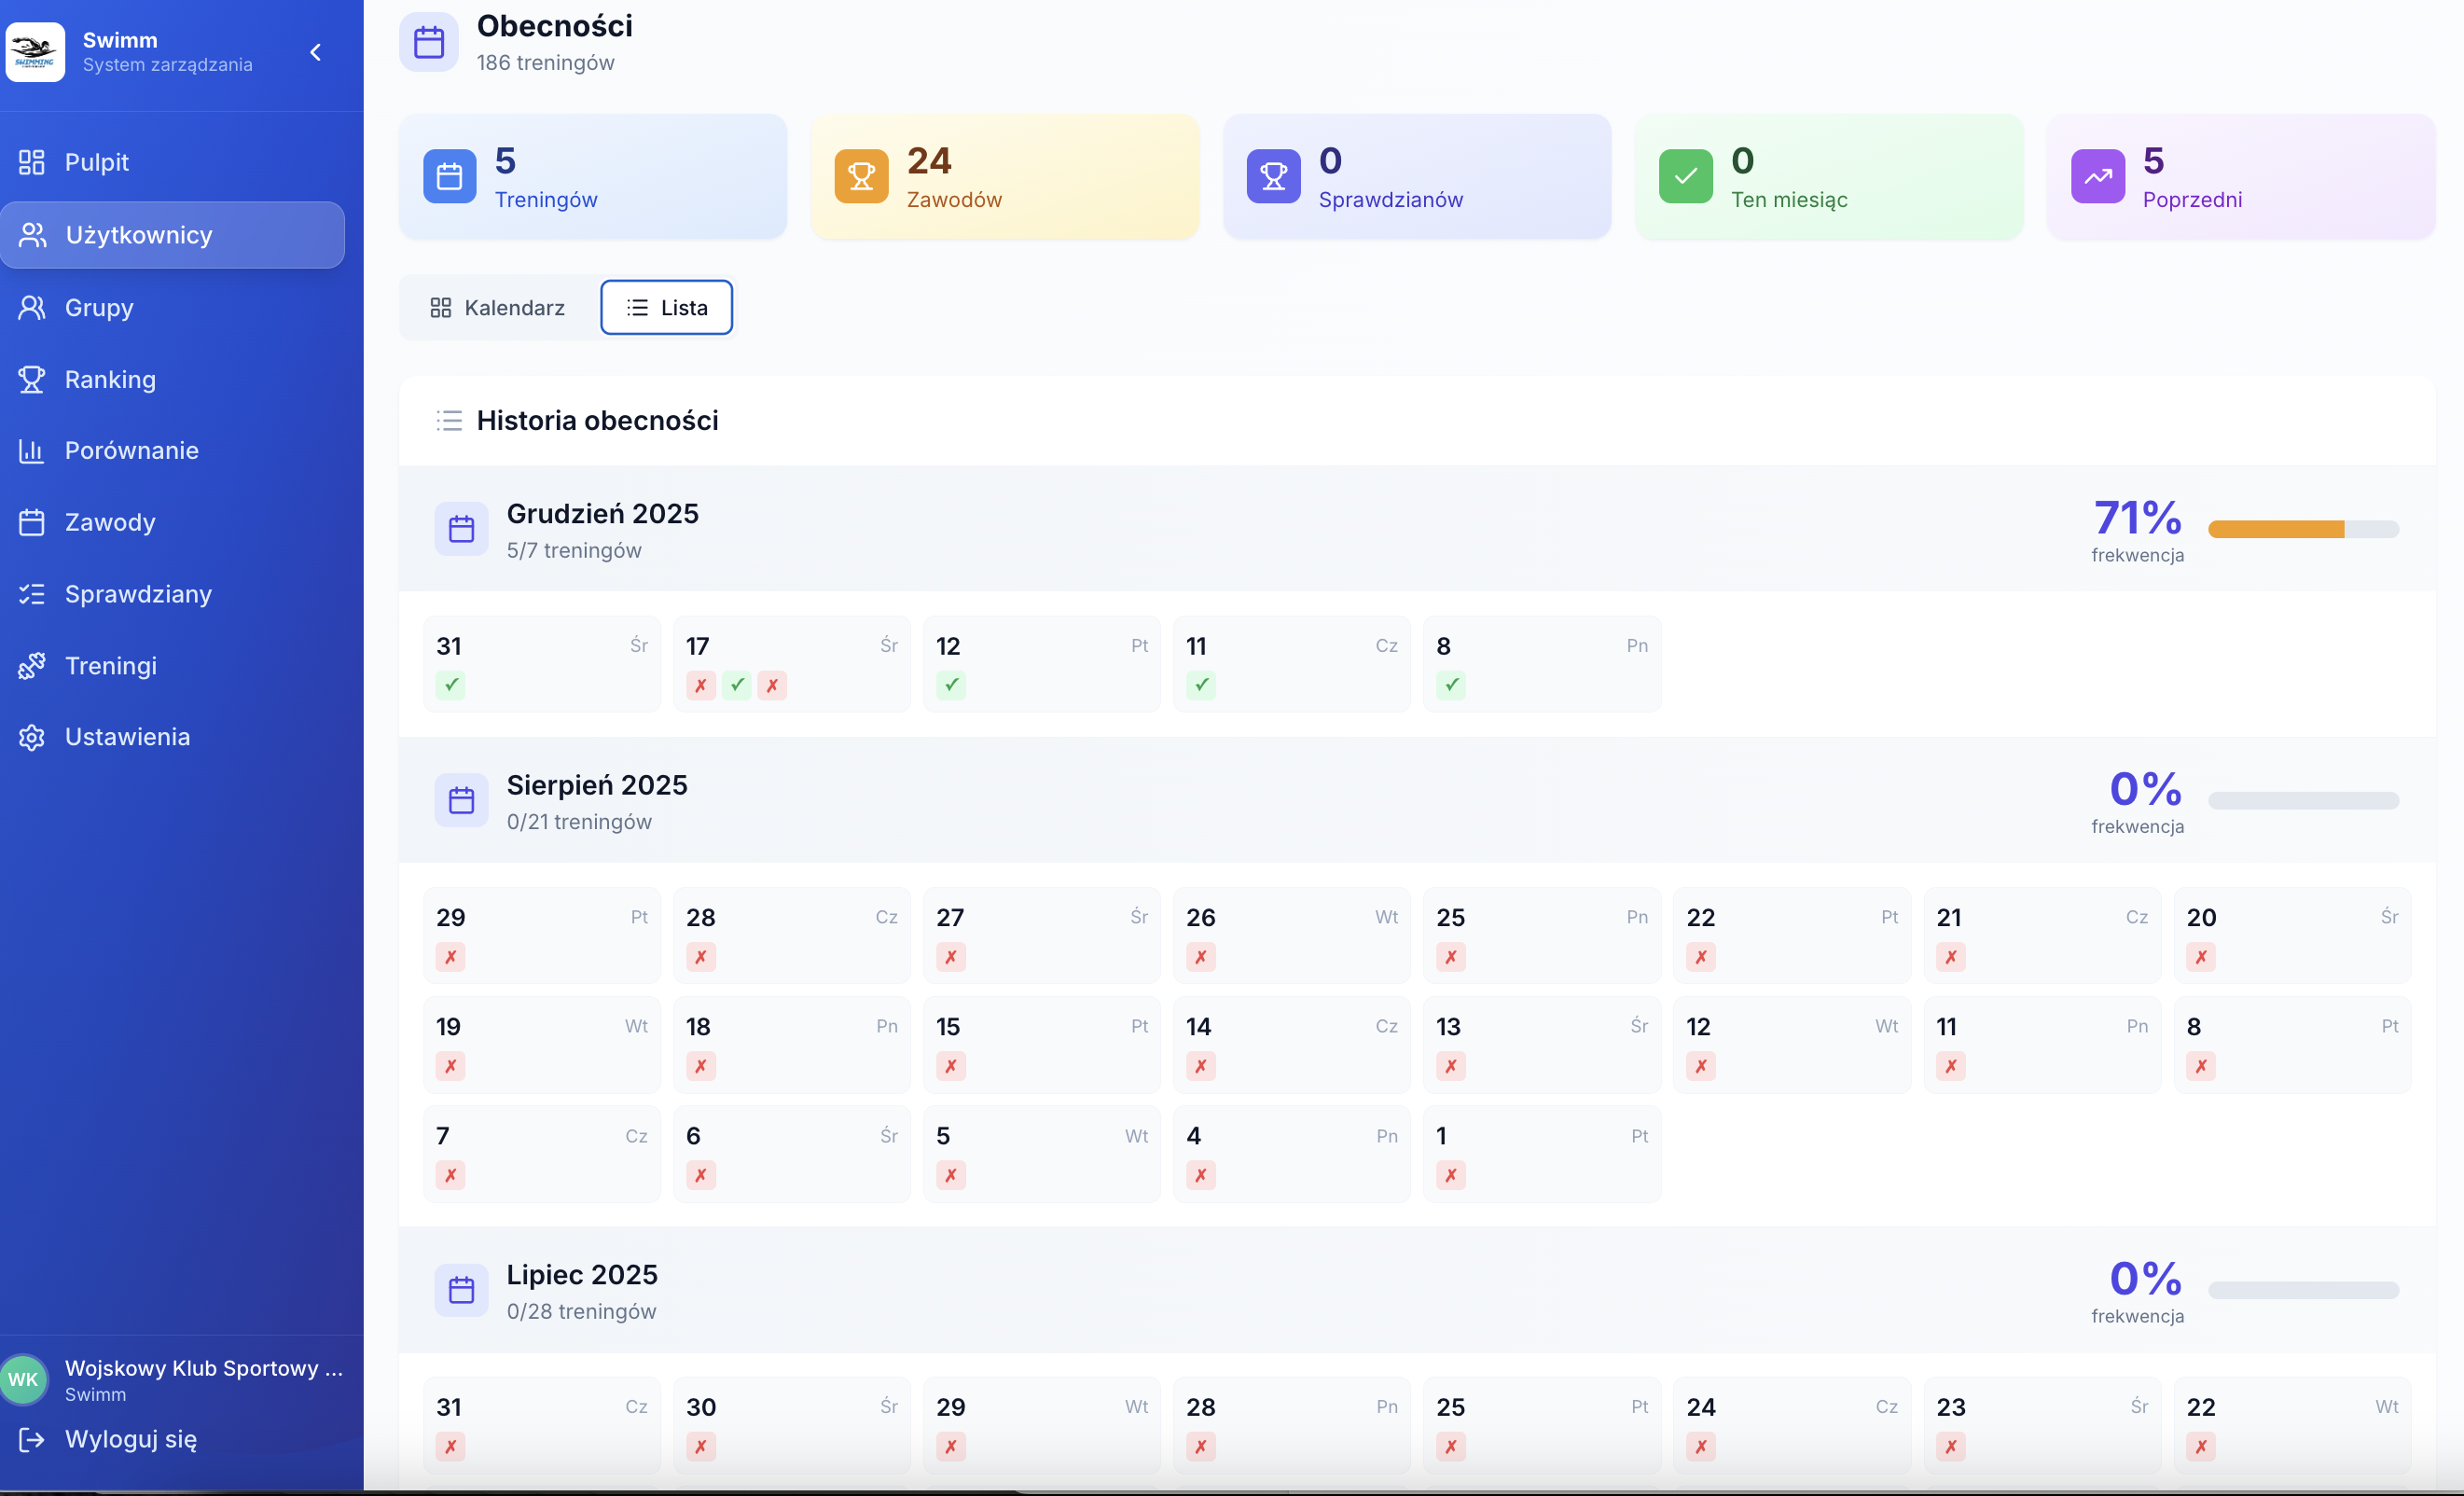
Want to see this on your group’s data?
We’ll show: groups → training → attendance → mileage → tests → results and rankings → reports. The best way to estimate how much time you’ll save each week.
Top reasons clubs adopt it
- Attendance calculated automatically
- Mileage and workload reports from trainings
- Tests in module and group context
- LENEX meet import + one results database